Este artículo también está disponible en español.
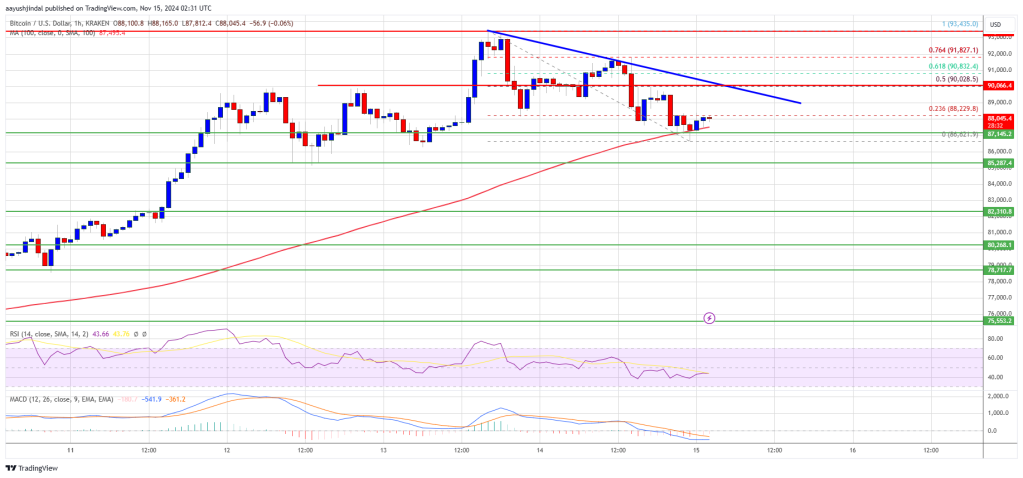
Bitcoin price saw a short-term correction from the $93,450 zone. BTC is now consolidating gains near $87,000 and might attempt another increase in the near term.
- Bitcoin started a downside correction from the $93,450 zone.
- The price is trading above $87,000 and the 100 hourly Simple moving average.
- There is a connecting bearish trend line forming with resistance at $90,000 on the hourly chart of the BTC/USD pair (data feed from Kraken).
- The pair could start a fresh increase if it stays above the $87,000 zone.
Bitcoin Price Starts Downside Correction
Bitcoin price attempted more gains above the $93,000 level. BTC traded to a new all-time high at $93,435 and recently started a short-term downside correction.
There was a minor decline below the $90,000 level. The price even dipped below the $88,000 level. A low was formed at $86,621 and the price is now consolidating. It is slowly moving higher and trading near the 23.6% Fib retracement level of the downward move from the $93,435 swing high to the $86,621 low.
Bitcoin price is now trading above $87,000 and the 100 hourly Simple moving average. On the upside, the price could face resistance near the $90,000 level. There is also a connecting bearish trend line forming with resistance at $90,000 on the hourly chart of the BTC/USD pair.
The trend line is close to the 50% Fib retracement level of the downward move from the $93,435 swing high to the $86,621 low. The first key resistance is near the $90,850 level. A clear move above the $90,850 resistance might send the price higher.

The next key resistance could be $91,500. A close above the $91,500 resistance might initiate more gains. In the stated case, the price could rise and test the $93,450 resistance level. Any more gains might send the price toward the $95,000 resistance level.
More Downsides In BTC?
If Bitcoin fails to rise above the $90,000 resistance zone, it could start a downside correction. Immediate support on the downside is near the $87,150 level.
The first major support is near the $86,500 level. The next support is now near the $85,280 zone. Any more losses might send the price toward the $82,500 support in the near term.
Technical indicators:
Hourly MACD – The MACD is now losing pace in the bearish zone.
Hourly RSI (Relative Strength Index) – The RSI for BTC/USD is now below the 80 level.
Major Support Levels – $87,150, followed by $86,500.
Major Resistance Levels – $90,000, and $91,500.


Cardano
Cardano Founder Reveals What Will Onboard 3 Billion New Users Into Crypto
Solana
Solana Compresses Near Previous ATH – Gearing Up For The Next Leg Higher?
Ripple
XRP Transactions Fall, But Active Wallets And DeFi Liquidity Tell A Different Story
Litecoin
Litecoin Looks Poised To Explode As Grayscale Buys 10,000 LTC
Dogecoin
Dogecoin Pulls Back To ‘The Golden Ratio’ – Analyst Expects A Bullish Reversal
Dogecoin
Dogecoin Adam & Eve Structure Hints At Bullish Potential – Can DOGE Breakout?
Litecoin
Analyst Says Litecoin Will Outperform Bitcoin And Large Cap Cryptos With 11,000% Breakout
Dogecoin
Dogecoin $10 Price Target Back In Play? Here’s What The Charts Say