
Este artículo también está disponible en español.
Crypto analyst Kevin (@Kev_Capital_TA) has identified a bullish pennant formation in the 4-hour Dogecoin / USD price chart, indicating that a significant price movement could occur by this coming Saturday. In a post on X, Kevin remarks: “Dogecoin is now forming a more defined potential bullish pennant that has multiple touch points on each side with plenty of consolidation time. Something to keep an eye on folks.”
Dogecoin Price Breakout By Saturday?
The chart shared by Kevin illustrates a bull pennant pattern. A bull pennant typically signifies a pause in a prevailing uptrend, followed by a potential continuation of that trend. This pattern is characterized by converging trend lines that encapsulate a period of price consolidation after a strong upward movement.
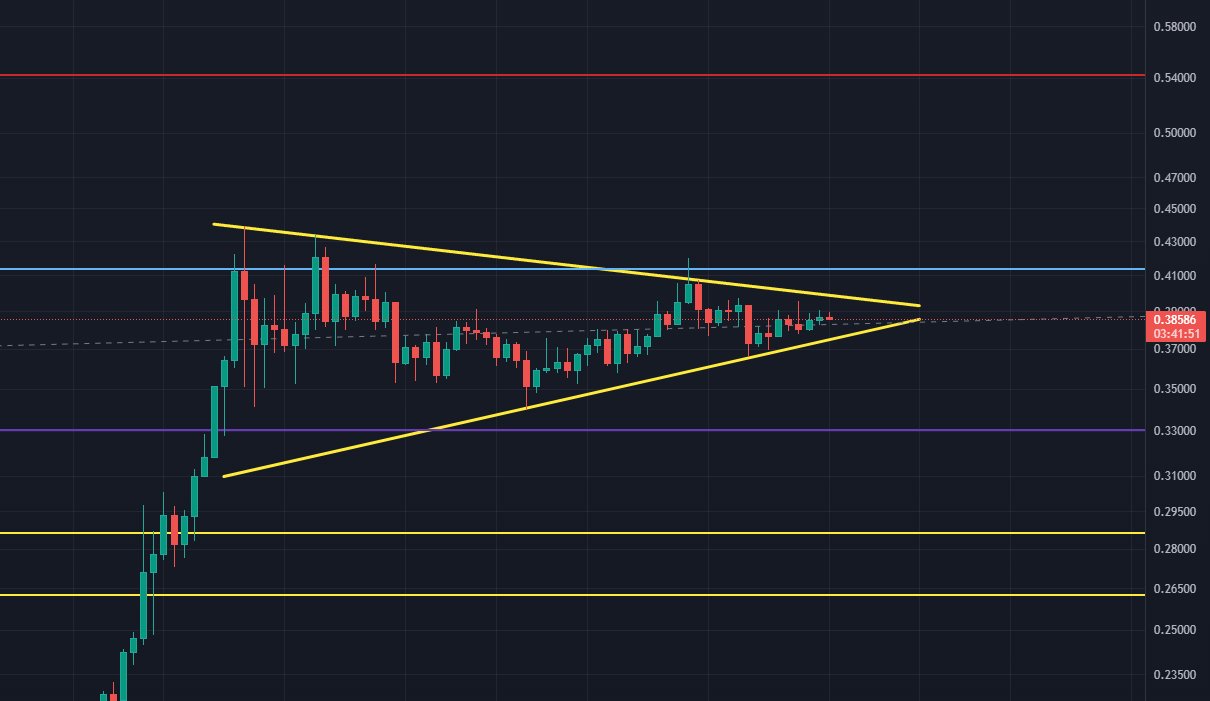
In Dogecoin’s case, the pennant is delineated by converging yellow trend lines, indicating decreasing volatility and a consolidation phase. The memecoin is trading around $0.38 within this pennant structure. Kevin’s analysis suggests that this critical breakout could happen “by Saturday at the latest.”
Related Reading
In technical analysis terms, a breakout occurs when the price moves beyond the defined trend lines of a formation, signaling a potential continuation or reversal of the trend. Given the bullish momentum preceding the pennant formation, an upward breakout is often anticipated. However, Kevin maintains a cautious stance by acknowledging market unpredictability: “Up or down,” he notes.
The chart also highlights several horizontal lines representing key support and resistance levels. The upper resistance is identified around $0.54, which could be tested if an upward breakout occurs. Conversely, immediate support levels are situated around $0.33 and $0.2950, which would be critical if the price breaks downward.
Related Reading
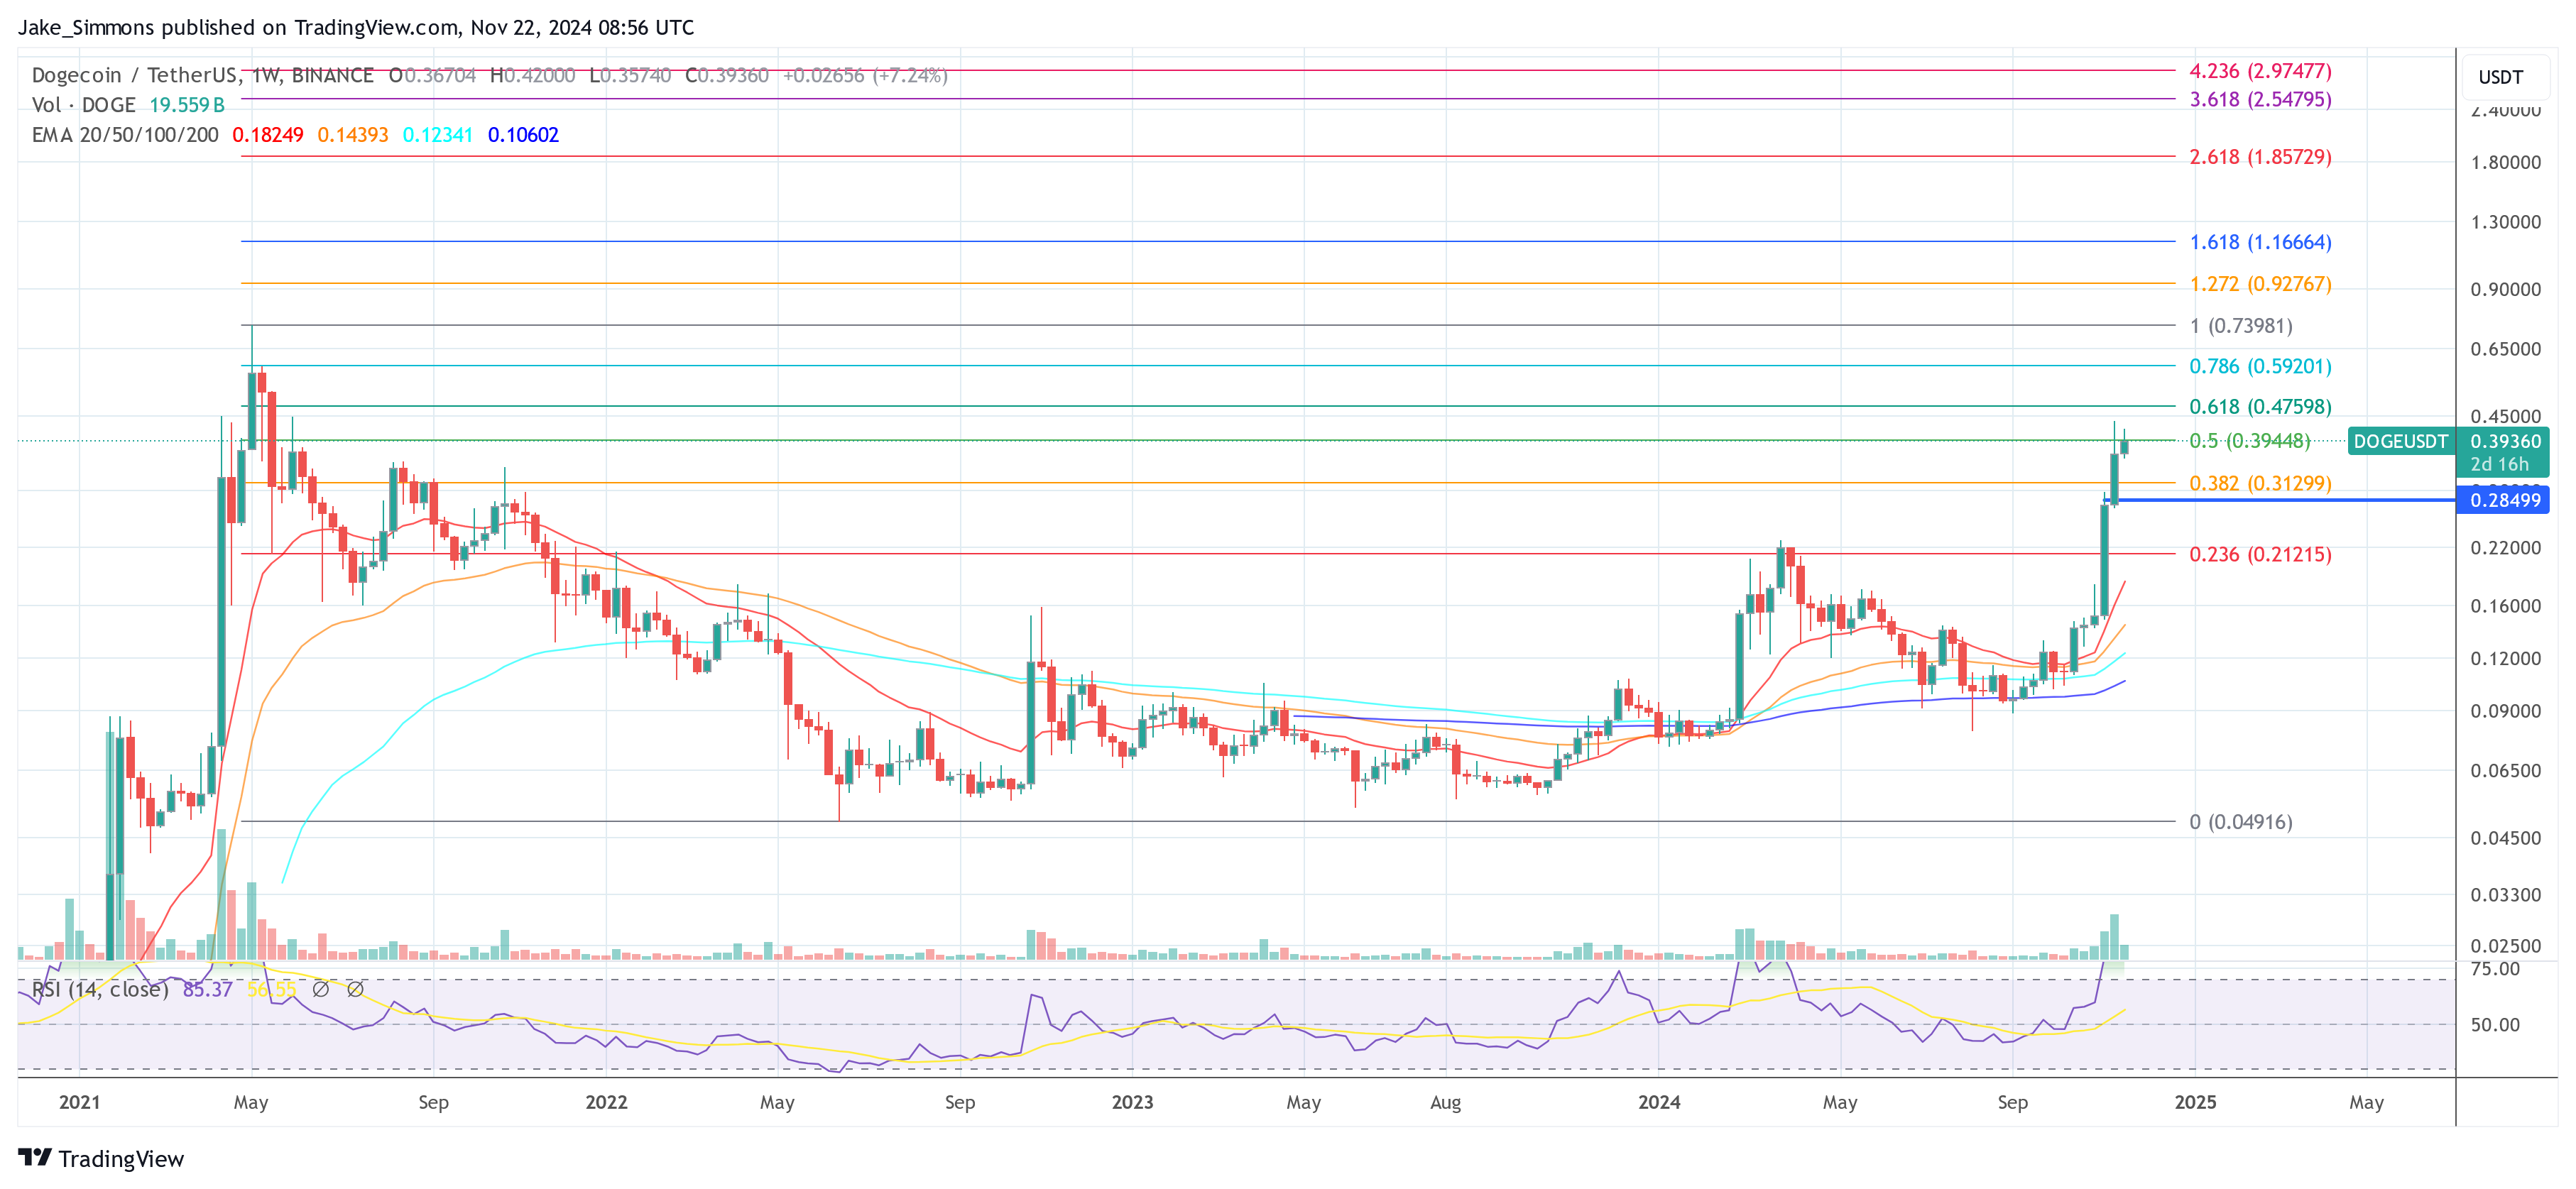
Kevin also emphasizes the role of the stochastic Relative Strength Index (RSI) in the daily chart. He states: “The stochastic RSI is a phenomenal momentum indicator in strong trends in either direction. The daily RSI is almost reset for Dogecoin and probably needs another week give or take a few days to fully reset. Once it does, I expect the next leg to begin.”
The stochastic RSI is a technical momentum indicator that compares the level of the RSI to its high-low range over a set period, providing insights into potential overbought or oversold conditions. A reset in the daily RSI suggests that previous overbought conditions have eased, potentially paving the way for the next significant price movement.
Further emphasizing the potential impact of the current consolidation phase, Kevin adds: “The longer Dogecoin consolidates, the bigger the next leg will be. In my opinion, the next leg will be the biggest leg of the DOGE bull run and will give us a good idea where it’s going to top out at for the cycle.”
At press time, DOGE traded at $0.39.
Featured image created with DALL.E, chart from TradingView.com

Ripple
XRP Transactions Fall, But Active Wallets And DeFi Liquidity Tell A Different Story
Cardano
Cardano Founder Reveals What Will Onboard 3 Billion New Users Into Crypto
Dogecoin
Whales Accumulate 100 Million Dogecoin In 24 Hours – Demand Signals Growing Confidence
Solana
Solana Compresses Near Previous ATH – Gearing Up For The Next Leg Higher?
Bitcoin
ADA Sights More Growth After Breaking $0.8119
Bitcoin
Avalanche Nears Breakout – Top Analyst Sets $420 Target For AVAX This Cycle Avalanche (AVAX) has surged over 40%, reaching a critical supply level that, if broken, could trigger a substantial rally. The…
Litecoin
Litecoin Looks Poised To Explode As Grayscale Buys 10,000 LTC
Dogecoin
Dogecoin Pulls Back To ‘The Golden Ratio’ – Analyst Expects A Bullish Reversal