

Este artículo también está disponible en español.
Bitcoin price is recovering higher above the $94,000 level. BTC is consolidating and aims for a fresh increase above the $97,000 level.
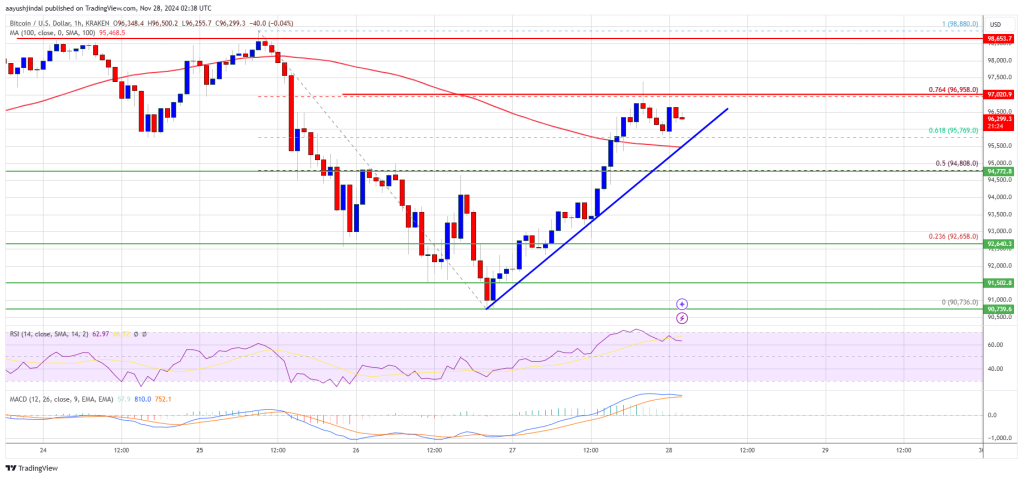
- Bitcoin started a fresh increase from the $91,000 zone.
- The price is trading above $95,000 and the 100 hourly Simple moving average.
- There is a connecting bullish trend line forming with support at $95,750 on the hourly chart of the BTC/USD pair (data feed from Kraken).
- The pair could gain bullish momentum if it clears the $97,000 resistance zone.
Bitcoin Price Recovers Losses
Bitcoin price found support near the $91,000 zone. BTC formed a base and started a fresh increase above the $93,500 resistance zone. The bulls were able to push the price above the $95,000 resistance zone.
The price surpassed the 50% Fib retracement level of the downward move from the $98,880 swing high to the $90,735 low. There is also a connecting bullish trend line forming with support at $95,750 on the hourly chart of the BTC/USD pair.
Bitcoin price is now trading above $95,000 and the 100 hourly Simple moving average. On the upside, the price could face resistance near the $97,000 level. It is near the 76.4% Fib retracement level of the downward move from the $98,880 swing high to the $90,735 low.
The first key resistance is near the $98,000 level. A clear move above the $98,000 resistance might send the price higher. The next key resistance could be $99,200. A close above the $99,200 resistance might initiate more gains. In the stated case, the price could rise and test the $100,000 resistance level. Any more gains might send the price toward the $102,000 level.
Another Drop In BTC?
If Bitcoin fails to rise above the $97,000 resistance zone, it could start another downside correction. Immediate support on the downside is near the $95,750 level.
The first major support is near the $95,000 level. The next support is now near the $93,000 zone. Any more losses might send the price toward the $91,000 support in the near term.
Technical indicators:
Hourly MACD – The MACD is now gaining pace in the bullish zone.
Hourly RSI (Relative Strength Index) – The RSI for BTC/USD is now above the 50 level.
Major Support Levels – $95,750, followed by $95,000.
Major Resistance Levels – $97,000, and $98,000.

Cardano
Cardano Price Eyes Impulse Move After Bearish RSI Divergence Was Invalidated, Here’s The Target
Solana
Solana Loses Long-Term Support Level – Analyst Shares Insights
Solana
Solana Faces Make-Or-Break Moment With $1.77 Billion Unlock
Cardano
Cardano Echoes 2020-2021 Pattern – Is A Parabolic Rally On The Horizon?
Cardano
Cardano Could Move Up To $0.83 If Momentum Holds – Can ADA Sustain A Breakout?
Dogecoin
Dogecoin Will Start A Move To $4 If Current Demand Holds – Can Bulls Step In? Dogecoin is trading below key liquidity levels as the price struggles with intense selling pressure. The entire meme coin market…
Dogecoin
Dogecoin Holds Critical Support Level – Can Bulls Reclaim $0.25?
Solana
More Pain Ahead For Solana? Dangerous Price Drop To $125 Looms With This Support Retest